Instrumentation
Introduction
Spoor automatically injects instrumentation to log each function's entry and exit. This allows you to reconstruct your application's runtime stack.
Supported languages
Spoor's instrumentation works with LLVM-based languages such as C, C++, and
Objective-C, Rust, Swift, Kotlin, Scala, and more.
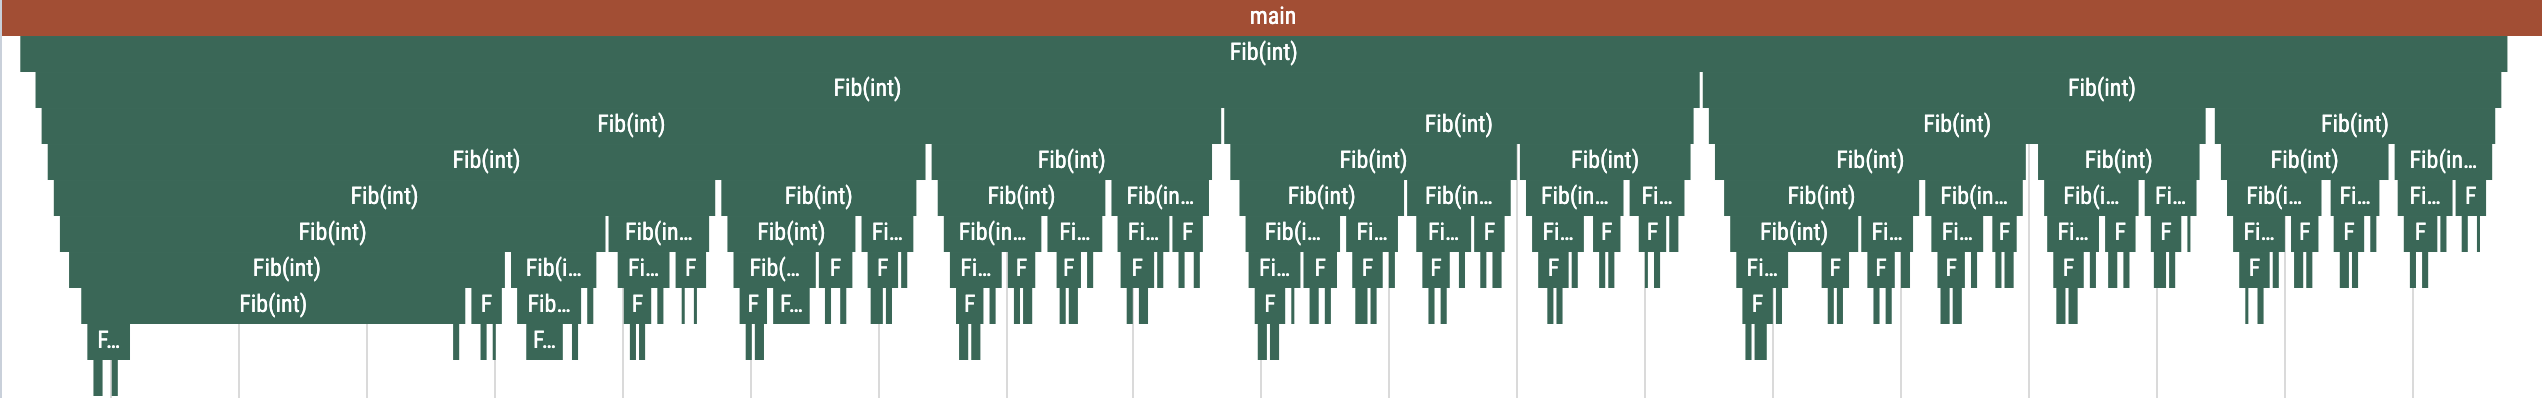
Demo
Check out the Fibonacci tutorial to see Spoor's instrumentation in action.
Packaging
Spoor's instrumentation is available in three flavors.
LLVM opt plugin
opt source.ll \
  -load-pass-plugin=libspoor_instrumentation.so \
  -passes="inject-spoor-instrumentation" \
  -S \
  -o source_instrumented.ll
Standalone executable
spoor_opt --help
spoor_opt: Transform LLVM Bitcode/IR by injecting Spoor instrumentation.

USAGE: spoor_opt [options...] [input_file]

EXAMPLES
$ spoor_opt source.bc --output_file=instrumented_source.bc
$ clang++ source.cc -c -emit-llvm -o - | spoor_opt | clang++ -x ir - -lspoor_runtime

Reads from stdin if an input file is not provided.
Prints to stdout if an output file is not provided.

  Flags from spoor/instrumentation/config/command_line.cc:
    --enable_runtime (Automatically enable Spoor's runtime.); default: true;
    --filters_file (File path to the filters file.); default: none;
    --force_binary_output (Force printing binary data to the console.);
      default: false;
    --initialize_runtime (Automatically initialize Spoor's runtime.);
      default: true;
    --inject_instrumentation (Inject Spoor instrumentation.); default: true;
    --module_id (Override the LLVM module's ID.); default: none;
    --output_file (Output file.); default: "-";
    --output_language (Language in which to output the transformed code.
      Options: bitcode, ir.); default: bitcode;
    --output_symbols_file (Spoor instrumentation symbols output file.);
      default: "";

Try --helpfull to get a list of all flags or --help=substring shows help for
flags which include specified substring in either in the name, or description or
path.
Xcode toolchain
Spoor provides clang and swift wrappers in an .xctoolchain to conveniently
integrate with Xcode and build with instrumentation on Apple platforms.
See get started with Spoor's Xcode toolchain for its installation and usage.
Automatic injection
Spoor instruments your source code by running a custom out-of-tree optimization pass over your source code’s LLVM intermediate representation. By default, it logs the funciton ID of each function it enters and exists alongside the events' timestamp. Function IDs are mapped back to the original function's properties in an emitted symbols file.
  define i64 @Add(i64, i64) {
+   call void @_spoor_runtime_LogFunctionEntry(...)
    %2 = add i64 %0, %1
+   call void @_spoor_runtime_LogFunctionExit(...)
    ret i64 %2
  }
Additionally, by default, the instrumentation inserts calls to initialize the runtime at the start of the main function and an API call to deinitialize the runtime before each return statement in the main function.
  define i32 main() {
+   call void @_spoor_runtime_Initialize()
+   call void @_spoor_runtime_Enable()
+   call void @_spoor_runtime_LogFunctionEntry(...)
+   call void @_spoor_runtime_LogFunctionEntry(...)
    %1 = call i32 @Add(1, 2)
+   call void @_spoor_runtime_LogFunctionExit(...)
+   call void @_spoor_runtime_Deinitialize()
    ret i32 %1
  }
This behavior is configurable.
Function IDs
Each function is represented by a unique, unsigned 64-bit integer. This value is
logged by LogFunctionEntry and LogFunctionExit.
Function IDs should be treated as opaque values that are globally unique.
Implementation
Function IDs are composed of a module ID spanning the most significant 32 bits and a local function ID spanning the remaining (least significant) 32 bits. The module ID is a CityHash hash of the module's LLVM instructions making it (very likely to be) be globally unique. Within each module, each function is sequentially assigned a local function ID starting from 0.
Example function ID
 0x89ABCDEF00000001
   |------||------|
 Module ID  Local function ID
Note: The implementation is subject to change and is not a value on which one should rely or assume to be stable between Spoor versions.
Symbols
Function IDs are mapped back to the original function's information in an emitted symbols file. This information includes the function's name, source file, line number, etc.
The .spoor_symbols file is a binary Protocol Buffer that conforms to the
following schema:
spoor/instrumentation/symbols/symbols.proto
Inspect the symbols file and symbolize traces using Spoor's postprocessing tools.
Configuration
Spoor's automatic instrumentation inject behavior is configurable. You can choose which functions get instrumented and if the runtime is automatically initialized and enabled.
See Spoor's instrumentation configuration page for details.
Function filtering
Function filtering is an important optimization strategy. Spoor instruments every function by default, however, logging less improves your application's runtime performance, reduces the amount of memory that Spoor's runtime must consume to buffer the events, and speeds up Spoor's postprocessing tools.
Although each application benefits from a unique set of filters tailored to its use and environment, there are a few general strategies to consider when deciding what to filter.
Privacy
Filter functions that could log sensitive information. For example, if you're
implementing a keyboard and have button handlers didTapA(), didTapB(),
didTapC(), etc., without filtering these functions you're using Spoor as a
key logger!
Relevance
Instrument the code that you plan to optimize. For example, it might be interesting to know when your application makes a library call but not the library's implementation, especially if its implementation is noisy.
Function size
Most functions are very small -- just tens of IR instructions in size. It is often reasonable to apply a heuristic that functions with few instructions are fast (but might call larger and more expensive functions). Additionally, the cost of logging the function's entry and exit might exceed the cost of the function's logic itself. Thus, filtering these small function calls saves a significant amount of runtime overhead while still logging the larger and more "interesting" functions.
50% of functions in Wikipedia's iOS app are less than 15 IR instructions and 95% are at most 140 IR instructions. Internal experiments show that this distribution is roughly representative of other programs.
| Percentile | IR instruction count |
|---|---|
| 0.5 | 14 |
| 0.9 | 76 |
| 0.95 | 140 |
| 0.99 | 406 |
| 0.999 | 1217 |
| 0.9999 | 2424 |